
Social media ROI is critical for enterprise tech in 2025. Companies are using advanced analytics, AI tools, and short-form video to drive measurable results. Key highlights include:
- TikTok leads in engagement with a 2.50% rate, outperforming Instagram (0.50%) and Facebook/X (0.15%).
- Short-form video dominates, with 66% viewer retention and 2.5× higher engagement than longer formats.
- LinkedIn delivers 229% ROI over three years for B2B lead generation, making it a top platform for enterprise tech.
- AI adoption has grown 186%, helping marketers track engagement and personalize content effectively.
Focus on creating platform-specific strategies, leveraging AI for data insights, and prioritizing short-form videos to maximize ROI.
The Best LinkedIn Growth Strategy in 2025
2025 Platform-Specific ROI Data
Enterprise tech companies are showing varied returns on investment (ROI) from social media platforms in 2025. With engagement rates shifting, here’s a closer look at how key platforms are performing.
LinkedIn Performance Metrics
LinkedIn continues to dominate in B2B lead generation, delivering an average organic ROI of 229% over three years . For most companies, qualified leads start to appear after 6–8 months of consistent organic activity .
"As search on social continues to grow, we'll see even more value put on the insights we can gather to generate content which gives our community a reason to engage." – Kymberley Thomson, Senior Global Social Media & Community Manager at Primark
Twitter vs Facebook Results
Both Twitter and Facebook report an organic engagement rate of 0.15% in 2025. Facebook has seen a 35% drop in impressions, pushing many brands toward paid strategies. On the other hand, Twitter Ads have proven to be cost-effective, generating leads at one-third the cost of other channels. For example, Hootsuite’s promoted tweets achieved a 4.71% engagement rate, significantly higher than the 1% industry average .
Instagram and TikTok Results
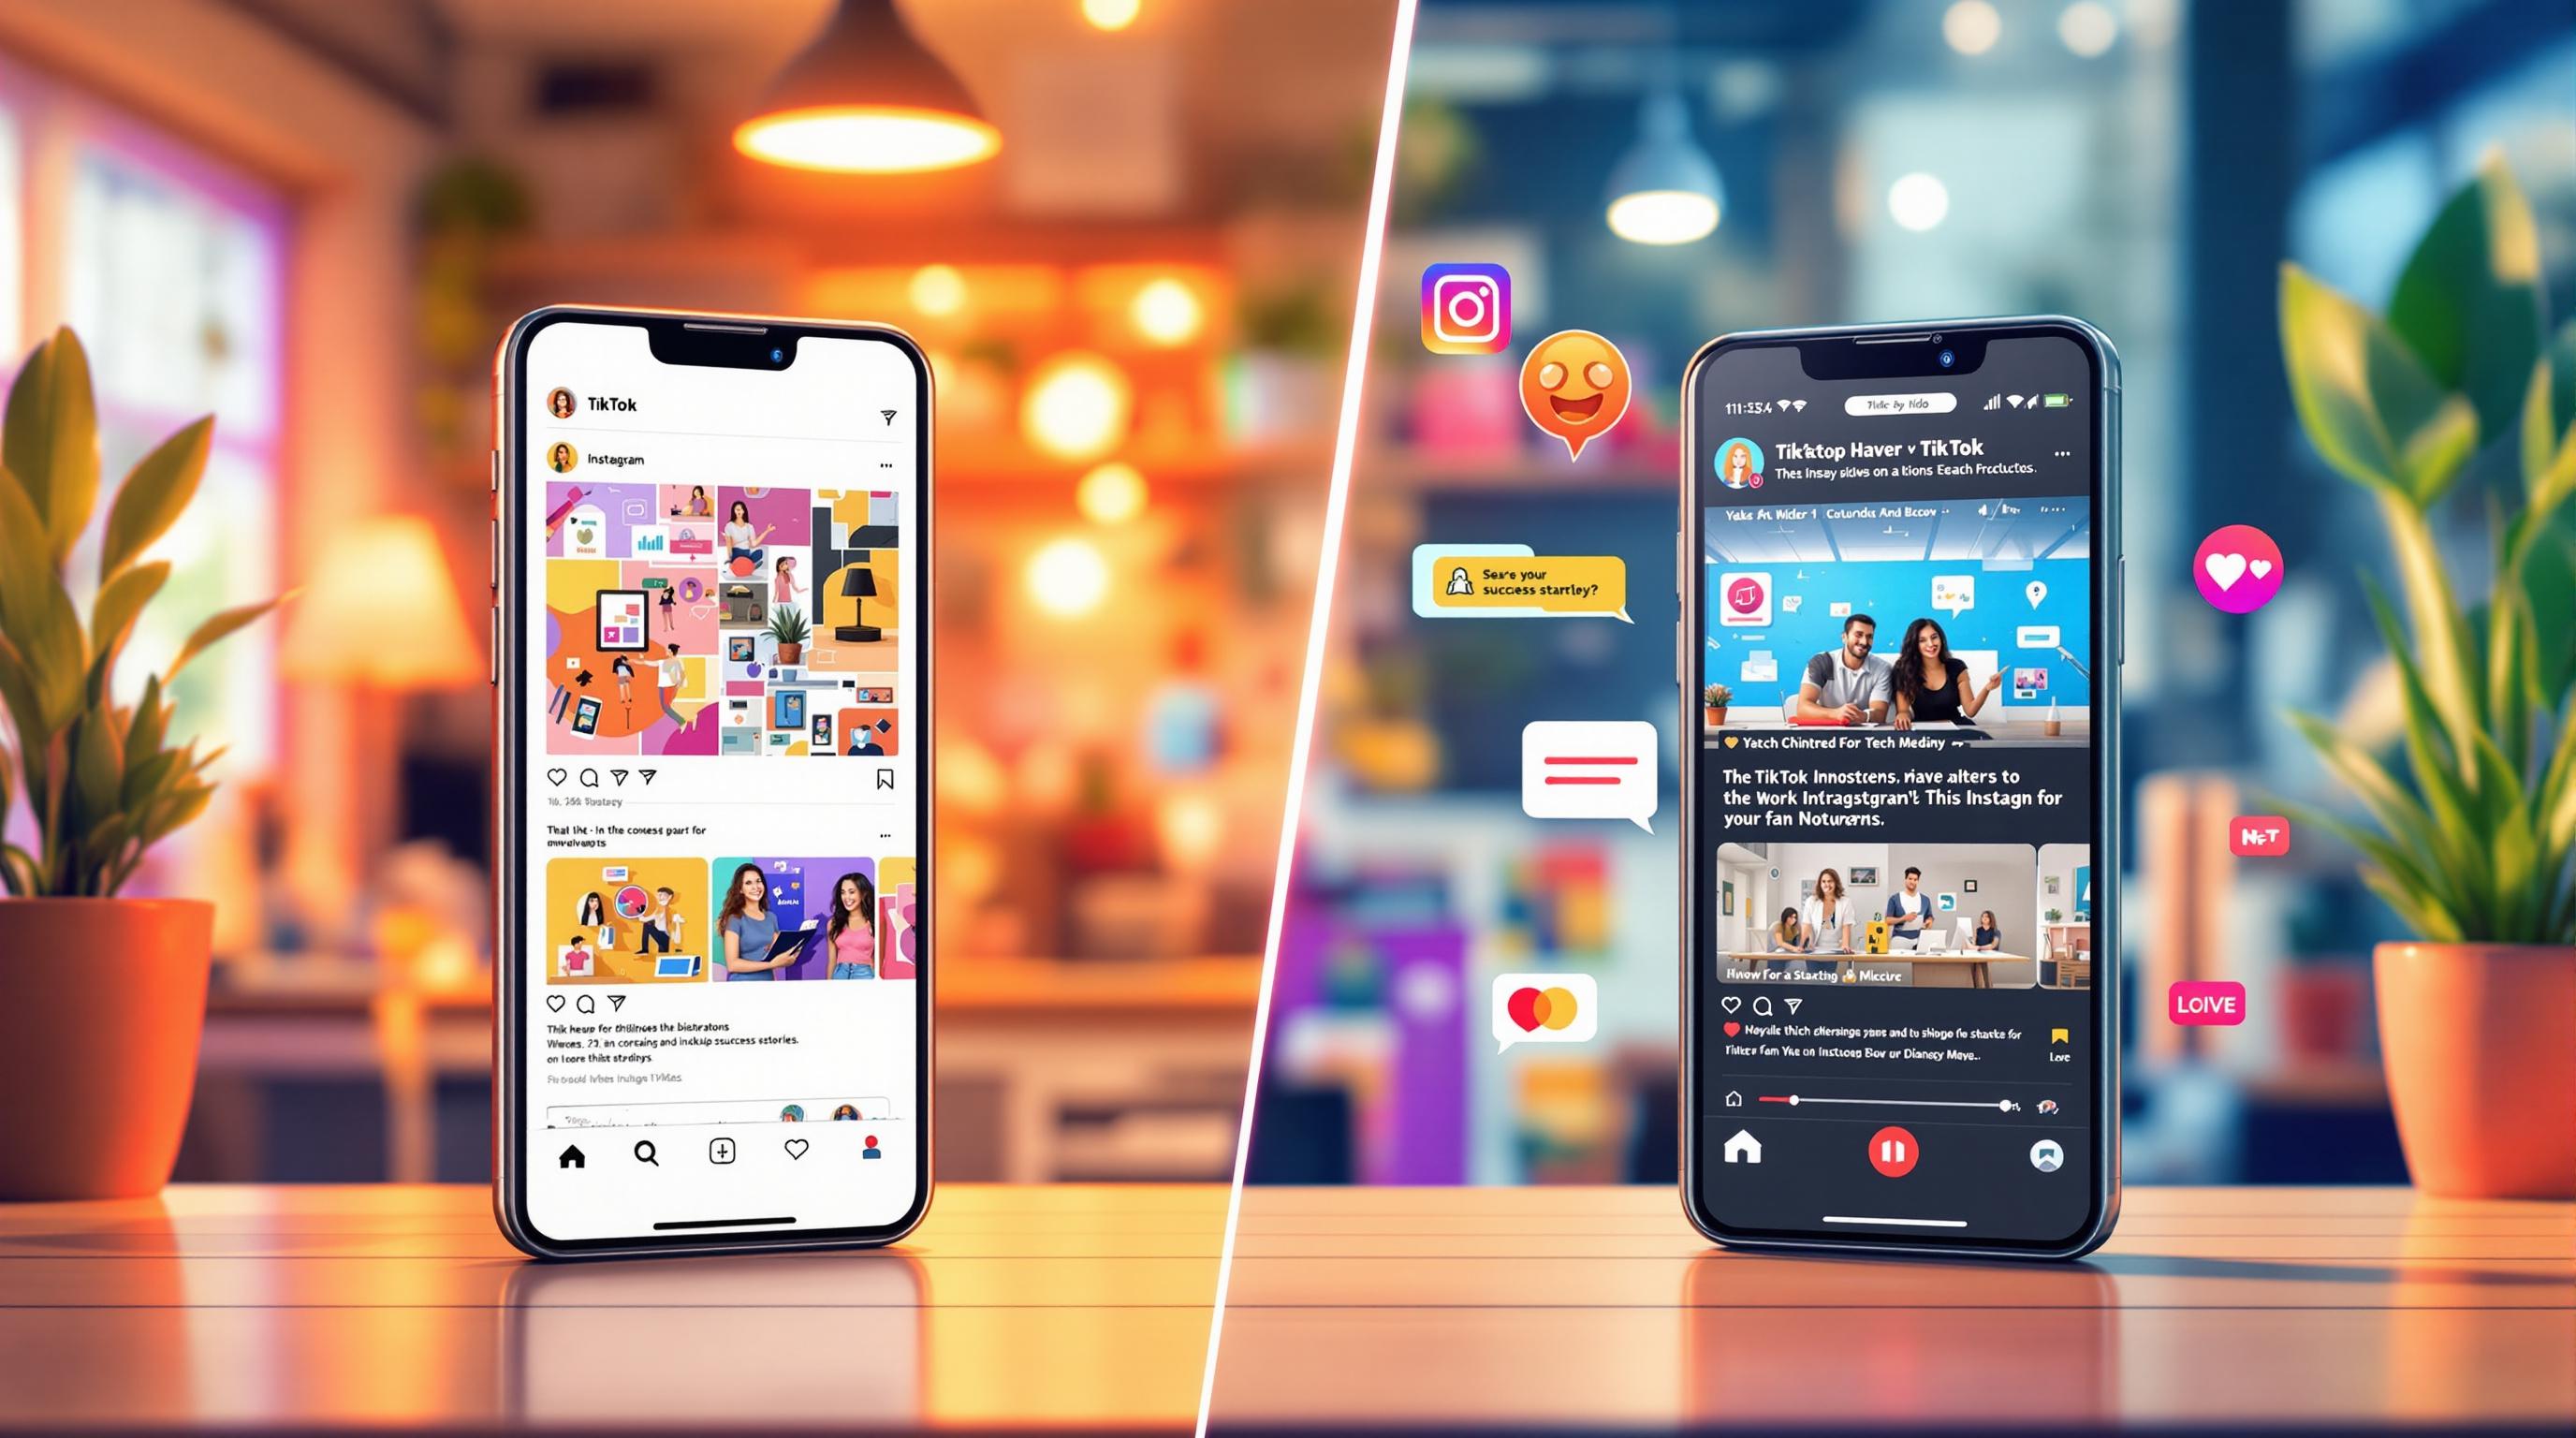
TikTok leads in organic engagement, while Instagram has shifted its focus toward reach.
"TikTok's crushing it and we're seeing better engagement and lower CPMs than Instagram for our clients. But here's the thing: it's not about chasing platforms. If your audience is somewhere, that's where you need to be, creating content that actually makes sense for that space." – Kineta Kelsall, Founder & Director of School of Social
Here’s how the two platforms compare on key metrics:
| Metric | TikTok | |
|---|---|---|
| Engagement Rate | 2.50% | 0.50% |
| Likes/Post | 3,092 | 395 |
| Comments | 66 (+73% YoY) | 24 (+33% YoY) |
| Impressions | 6,268 | 2,635 (+13% YoY) |
| Posts/Week | 2 | 5 |
Tech and software brands have found success on Instagram by using strategic hashtags. For instance, #marketing outperformed hashtags like #tech and #gaming, driving four times more engagement .
Content Format ROI Analysis
In 2025, the return on investment (ROI) for content formats varies significantly. Short-form videos dominate in engagement, while visual content excels at simplifying complex ideas.
Video ROI Data
Short-form videos, particularly those under 60 seconds, are leading the pack. These videos boast a 66% viewer retention rate and deliver 2.5× higher engagement compared to longer formats:
| Video Format | Viewer Retention | Engagement Rate |
|---|---|---|
| Under 60 seconds | 66% complete views | Highest (2.5× vs. long-form) |
| 90 seconds or less | 50% retention | Above average |
| 5–30 minutes | 38% average engagement | Moderate |
| 30–60 minutes | 26% average engagement | Lowest |
Consumer demand for bite-sized content is surging, with 81% of users seeking more micro-content. This trend is driving short-form video ad spending, which is expected to hit approximately $99.4 billion by the end of 2024 .
"Stay flexible as new platforms and features are sure to keep popping up. The winners will be those who show their human side while being tech-savvy, finding that sweet spot between being genuine and innovative. Remember, it's about creating connections, not likes, that matter. Roll with the changes and keep it real!" - Dorien Morin, Social Media Strategist @ More in Media
Although video content is highly engaging, combining it with concise text and strong visuals can amplify its impact even further.
Written and Visual Content Results
Visual content continues to outperform text in engagement. Studies show that 40% of customers respond better to visual information than to text alone . The human brain processes images in just 13 milliseconds, making visuals an ideal choice for conveying enterprise tech messages .
Here’s how different content types perform:
| Content Format | Retention Rate | Response Rate |
|---|---|---|
| Visual Content | 80% remembered | 40% better response |
| Written Content | 20% remembered | Baseline |
| Audio Content | 10% remembered | Below baseline |
"Visual elements build trust and shape consumer perception. It's important to understand the influence decision-making process, and how it ultimately contributes to the bottom line of business across diverse sectors." - Caroline Petersen, Owner of Gallery Design Studio
Enterprise tech companies are excelling by blending visual storytelling with data presentation. Formats like infographics and data visualizations are particularly effective for breaking down complex topics .
Consumer behavior reflects this shift toward visuals, with 72% preferring video over text when researching products . This trend is expected to contribute to 82% of internet traffic being video-based by 2025, much of it driven by short-form content .
sbb-itb-3858882
Tech Sector ROI Breakdown
Enterprise tech segments show varied patterns in social media ROI. For instance, the median 3-year ROI for software is 278%, with an annualized internal rate of return (IRR) of 41% .
Cloud and SaaS ROI Data
Cloud and SaaS businesses are seeing strong social media returns, supported by a U.S. market expected to reach $908.21 billion by 2025 . On average, software investments in this space achieve a payback period of just 6 months .
| ROI Metric | Cloud/SaaS Performance |
|---|---|
| LinkedIn Lead Generation | 80% of B2B leads |
| Carousel Post Engagement | 5× more clicks |
| Content Marketing ROI | 278% (3-year) |
Software that directly impacts revenue generation tends to outperform software focused on non-revenue tasks . As one industry expert put it:
"SaaS applications are no longer just tools; they are strategic assets that drive business growth and innovation."
Meanwhile, hardware and IT services follow a different path when it comes to social media engagement.
Hardware and IT Services Results
For hardware and IT services companies, social media remains a key revenue driver, with 60% of B2B marketers citing it as their primary channel . These businesses also exhibit distinct preferences for certain platforms, emphasizing the importance of customizing strategies for different tech sectors.
ROI Improvement Methods
Enterprise tech companies can boost their social media ROI by using advanced AI-powered analytics tools. These platforms are helping businesses refine strategies and see better results.
Using Analytics Tools
Here’s a quick comparison of some top analytics platforms and what they’re best at:
| Analytics Tool | Key Strength | Best Use Case |
|---|---|---|
| Sprinklr | AI-driven insights | Cross-platform analytics |
| Hootsuite | Optimal posting times | Content scheduling |
| Meltwater | Social listening | Brand monitoring |
| Semrush Social | Competitor insights | Market analysis |
Since 2020, AI adoption in marketing has grown by 186%, and personalized content has been shown to increase purchase likelihood by 80% . These AI tools dig into complex data, providing insights that help businesses fine-tune their social media strategies and improve ROI. As these tools evolve, they are already shaping the future of ROI strategies.
2026 ROI Forecast
The advancements in analytics are paving the way for new ROI strategies. Video content continues to dominate, with 86% of marketers reporting better engagement and ROI from this format . Below is a summary of platform-specific engagement rates expected for 2025:
| Platform | 2025 Engagement Rate | Trend |
|---|---|---|
| TikTok | 2.50% | Stable |
| 0.50% | -28% YoY | |
| 0.15% | Shifting to groups | |
| X (Twitter) | 0.15% | Conversation-focused |
Beth Thomas, Director of Social at Frankly, offers a glimpse into the future of social engagement:
"We're moving more into the era of the silent viewers, the doom scrollers and attention will be even harder to have than before. We'll see more movement towards dark social as generations value their privacy more and more. But in the DMs and the closed groups, sharing of content will thrive."
Conclusion: Summary for Enterprise Tech
The landscape for enterprise tech ROI is evolving as we approach 2025. TikTok stands out with an impressive 2.50% engagement rate, while Instagram (0.50%), Facebook (0.15%), and X (0.15%) lag behind .
Success stories highlight the potential: Extra Space Storage achieved 14x rental conversion growth, and Tenengroup boosted conversions by 52% using TikTok .
Key takeaways for boosting ROI include:
| Strategy Area | Metric Highlight | Recommended Action |
|---|---|---|
| Video Content | 86% higher ROI | Focus on short-form video across platforms |
| AI Analytics | 186% growth in adoption | Use AI tools for engagement tracking |
| Social Commerce | $1.2T in projected sales | Build tailored purchase journeys per platform |
Personalization remains critical, with 80% of consumers favoring brands that deliver tailored experiences . Enterprise tech firms need to balance expanding their platform presence with creating focused, engaging strategies to stay ahead in ROI performance through 2025 and beyond.



























![Top 7 Best Instagram Growth Services in 2025 [RESULTS]](/cdn-cgi/image/fit=contain,format=auto,width=null/https://cdn.prod.website-files.com/67840d1d88a886f29a66a4c1/6795d12917ee4501b9eddf73_6795c731964f791db3b566c4-1737870861582.jpg)

![UpGrow Review – The Best Instagram Growth Service in 2025 [TESTED]](/cdn-cgi/image/fit=contain,format=auto,width=null/https://cdn.prod.website-files.com/67840d1d88a886f29a66a4c1/6795040db42e404207732526_6794fd9c964f791db3b48de9-1737818779111.jpg)

